
Abstract
Aims
Published poison-center tables may use different counting units, denominators, and medication definitions, limiting their reuse. We appraised the availability and comparability of National Poison Center (UZEM) medication-group data and described analgesic and separately classified anti-inflammatory/antirheumatic records.
Methods
This retrospective reporting appraisal and descriptive secondary analysis used the 728-page public 2014-2020 UZEM compendium. Eligible tables contained target-group records, related agents, age strata, or required denominators. Seven study-specific domains guided comparison decisions: temporal availability, denominators, agent definitions, repeated reporting, numerical consistency, clinical linkage, and coding changes. Primary descriptive measures were annual group counts and all-case percentages for 2018-2020, calculated using explicit same-year denominators. Published entries and arithmetic were verified against source tables. Repeated table entries were excluded from summation; incompatible agent definitions remained separate. No hypothesis testing was performed.
Results
Twenty-four core tables were included; five repeated full-distribution counts in top lists. Individual ages and target-group sex distributions were unavailable. For 2018, 2019, and 2020, analgesic counts were 13,423 (6.18%), 13,744 (6.31%), and 10,619 (5.66%); anti-inflammatory/antirheumatic counts were 20,560 (9.46%), 23,755 (10.90%), and 18,395 (9.81%). All-case denominators were 217,323, 217,936, and 187,528, respectively. Although analgesic counts decreased by 22.74% between 2019 and 2020, their share of human-health-product records changed from 8.96% to 8.63% (denominators 153,427 and 122,995, respectively). All 96 selected label/count/percentage combinations matched the source; 84 percentages with explicit denominators and five distributions comprising 1,242 rows were verified. General target-group distributions for 2014-2017 and group-linked clinical outcomes were not identified. Agent definitions differed across years, and coding stability was undocumented.
Conclusions
The appraisal linked annual medication-group summaries to their source definitions and documented denominator, classification, and clinical-linkage constraints on secondary use of the published compendium.
Keywords: Analgesics, anti-inflammatory agents, poison control centers, data accuracy, emergency medicine
Introduction
Analgesic exposures are a recognized reason for poison-center consultation in Türkiye (). These records describe reported contacts rather than all poisoning events. Eluri et al. () analyzed analgesic medication-error reports using counts and population-denominated reporting rates. The interpretation of such records depends on case definitions, substance coding, reporting behavior, and service organization.
The World Health Organization (WHO) describes the analysis of poison center enquiries as part of toxicovigilance, which seeks to identify toxic risks and assess measures taken to reduce them (). The information collected by these centers also contributes to surveillance and preparedness for chemical events ().
The National Poison Center (UZEM) compendium covers 2014-2020 but does not publish equivalent general medication-group tables for all seven years. It separately labels “analgesics” and “anti-inflammatory and antirheumatic products” (). These source categories cannot be assumed to map exactly to ATC N02/M01 or to represent all non-steroidal anti-inflammatory drugs (NSAIDs) without coding documentation.
Studies have examined therapeutic misuse of combination products (), adverse reactions in children (), intentional self-poisoning (), and paracetamol-related admissions and deaths (). These questions require exposure circumstances or clinical outcomes that cannot be inferred from medication-group counts alone.
The study asked which medication-group comparisons the published compendium could support after accounting for source populations, denominators, classification differences, and repeated entries. Analgesics and anti-inflammatory/antirheumatic products were selected purposively as clinically relevant, related but separately reported UZEM categories (,,). We aimed to produce annual descriptive summaries and a source-linked assessment of their comparability, identifying the information needed for additional analyses.
Methods
Study design and data source
This was a retrospective reporting appraisal and descriptive secondary analysis of published aggregate data from a single government document. The source was the 728-page UZEM Reports, 2014-2020, published by the Turkish Ministry of Health in 2021 as a PDF (). It was selected purposively to evaluate the research usability of the national reporting compendium for its stated period. This was not a systematic search for all UZEM publications or a study of recruited participants. The compendium contains annual reports for 2018-2020 and topic-specific appendices covering earlier years.
Applicable Strengthening the Reporting of Observational Studies in Epidemiology (STROBE) and REporting of studies Conducted using Observational Routinely-collected health Data (RECORD) items informed reporting (,). provides an applicability checklist. The are available online via the . Original section identifiers are retained on the reproduced source pages for traceability.
Source coverage and the quantitative comparison period were treated separately. The general medication-group distributions in UZEM source Tables 12, 44, and 69 supplied annual descriptions for 2018-2020. Published group labels and table structure were consistent, but underlying coding stability could not be verified. Earlier topic-specific appendices were examined for relevant entries and denominators, rather than substituted for missing general distributions. The foreword reports telephone-software renewal in 2016 and a July 2017 poison-recording update including ATC-based medication definitions; no versioned crosswalk for subsequent years was available ().
Ethical considerations
This secondary analysis used a publicly available government report containing anonymous, aggregated data. It involved no individual health records, participant contact, intervention, or identifiable personal information. Ethics committee approval was not obtained, and no formal exemption was sought or granted.
Reporting appraisal and table eligibility
Seven study-specific domains were selected retrospectively: temporal availability, denominators, category/agent definitions, repeated reporting, numerical consistency, clinical linkage, and coding changes. Checks of headings, cells, footnotes, and contextual text informed usability decisions for each variable/comparison. Matching general group labels supported qualified annual descriptions, whereas changed agent-list denominators prevented pooling. specifies the operational checks and mapping to STROBE and RECORD reporting items (,). These guidelines informed transparency; they were not used as validated appraisal instruments. No weighting, overall quality score, or prospective framework validation was undertaken.
We recorded source labels, populations, pages, and denominators and compared related entries. Variable/comparison statuses were “available,” “not identified,” “insufficiently defined,” or “broader-population only.” Missing values were neither zero-filled nor imputed. Conflicting published numbers were classified as source discrepancies; absent cross-tabulations or incompatible definitions were reporting limitations. Limitations of this analysis were recorded separately. links evidence to interpretation, and proposed reporting improvements are presented separately.
Tables were located using the compendium indexes and searches for Turkish and English group and ingredient names, with screening of annual chapters and appendices. Eligible tables reported either target group, related pain-treatment categories, relevant agents, age strata, or required denominators. General UZEM tables supplied context; unrelated tables were excluded. Repeated entries remained traceable but were excluded from summation, and incompatible agent definitions were kept separate. record the table references, source populations, labels, values, denominators, and repetitions. Study size denotes eligible core tables, not a recruited patient sample.
Variables and data extraction
Calls are incoming or answered telephone contacts; cases follow the UZEM definition. Group and agent records retain published labels, substances denote agents or products, and exposures mean substance contact without necessarily implying harm (). The aggregates cannot identify unique people or confirm hospital-diagnosed poisonings, so person-level deduplication was unavailable. Extraction rows represent table entries, not additional cases. International comparisons retain each source’s counting units.
The primary descriptive measures were each target group’s annual reported count and percentage of all source-defined UZEM cases in 2018-2020. There was no clinical primary endpoint or prespecified hypothesis test. Secondary descriptions covered proportions among human-health-product records, selected agent-list entries, age strata, and a pooled arithmetic summary. Muscle relaxants, topical pain products, and “opiates” remained separate. Group-specific mean or median age and sex proportions were not estimable from the available tables; broader-population demographics were not assigned to the target groups.
Artificial intelligence (AI) assisted extraction and code development as well as language editing. Access was limited to the published report; individual database records and coding documentation were unavailable. The extraction record and verification materials retain source locations so that the published entries and calculations can be checked.
Data verification and comparability
We excluded entries with related labels and matching counts from summation as possible repetitions; the aggregate tables could not establish that they referred to the same records. Agent names were retained as printed, including salt-specific, unspecified, and combination-product labels. Combination counts were not assigned to their individual ingredients, and a single-ingredient entry did not rule out co-exposure to other substances. Classification also differed across years: the 2018 human-health list used ATC names, while the later lists mixed classifications and changed denominators. Consequently, an unchanged agent name alone was insufficient to support comparison across years ().
In the verification run of 7 October 2026, all 96 selected combinations of labels, counts, and percentages matched the government PDF. Recalculation confirmed 84 percentages with explicit denominators, and five complete distributions containing 1,242 rows reproduced their published totals. These automated checks are separate from the original independent check by a second researcher, confirmed by the author. documents the parser correction and results. Executable code, source-linked extracts, source hashes, and outputs accompany the manuscript.
Selective reporting, unanswered calls, repeat reports, misclassification, software changes, truncated rankings, and uncertain agent overlap were potential sources of bias. We distinguished fields that were absent from those explicitly recorded as unknown and those outside the selected analysis. Their implications are discussed under Limitations.
International surveillance mapping
We selected United States National Poison Data System (NPDS) reports for the same years as the UZEM analysis (-), alongside an Australian national report () and Jordanian, Brazilian, and US studies illustrating different surveillance sources (-). records each source’s population, counting unit, denominator, and constraints on comparison. Comparisons were classified as “within-source descriptive,” “cross-source contextual,” or “unsupported for pooling.” The selection was purposive; it did not constitute a systematic review or a ranking of national systems.
Statistical Analysis
The analysis was descriptive. Published counts, list positions, and percentages were retained and distinguished from calculations made for this analysis. Annual percentages were calculated as 100 × n/N using the group count n and the explicitly stated same-year denominator N. Annual percentage change was 100 × (current/previous count -1). Secondary pooled percentages were 100 × summed annual group counts divided by summed annual all-case denominators. This calculation is a denominator-weighted summary of reported annual units; it does not estimate a proportion in a single deduplicated population. uses annual human-health-product denominators, while presents both denominator definitions. and , retain published percentages. No inferential tests were performed.
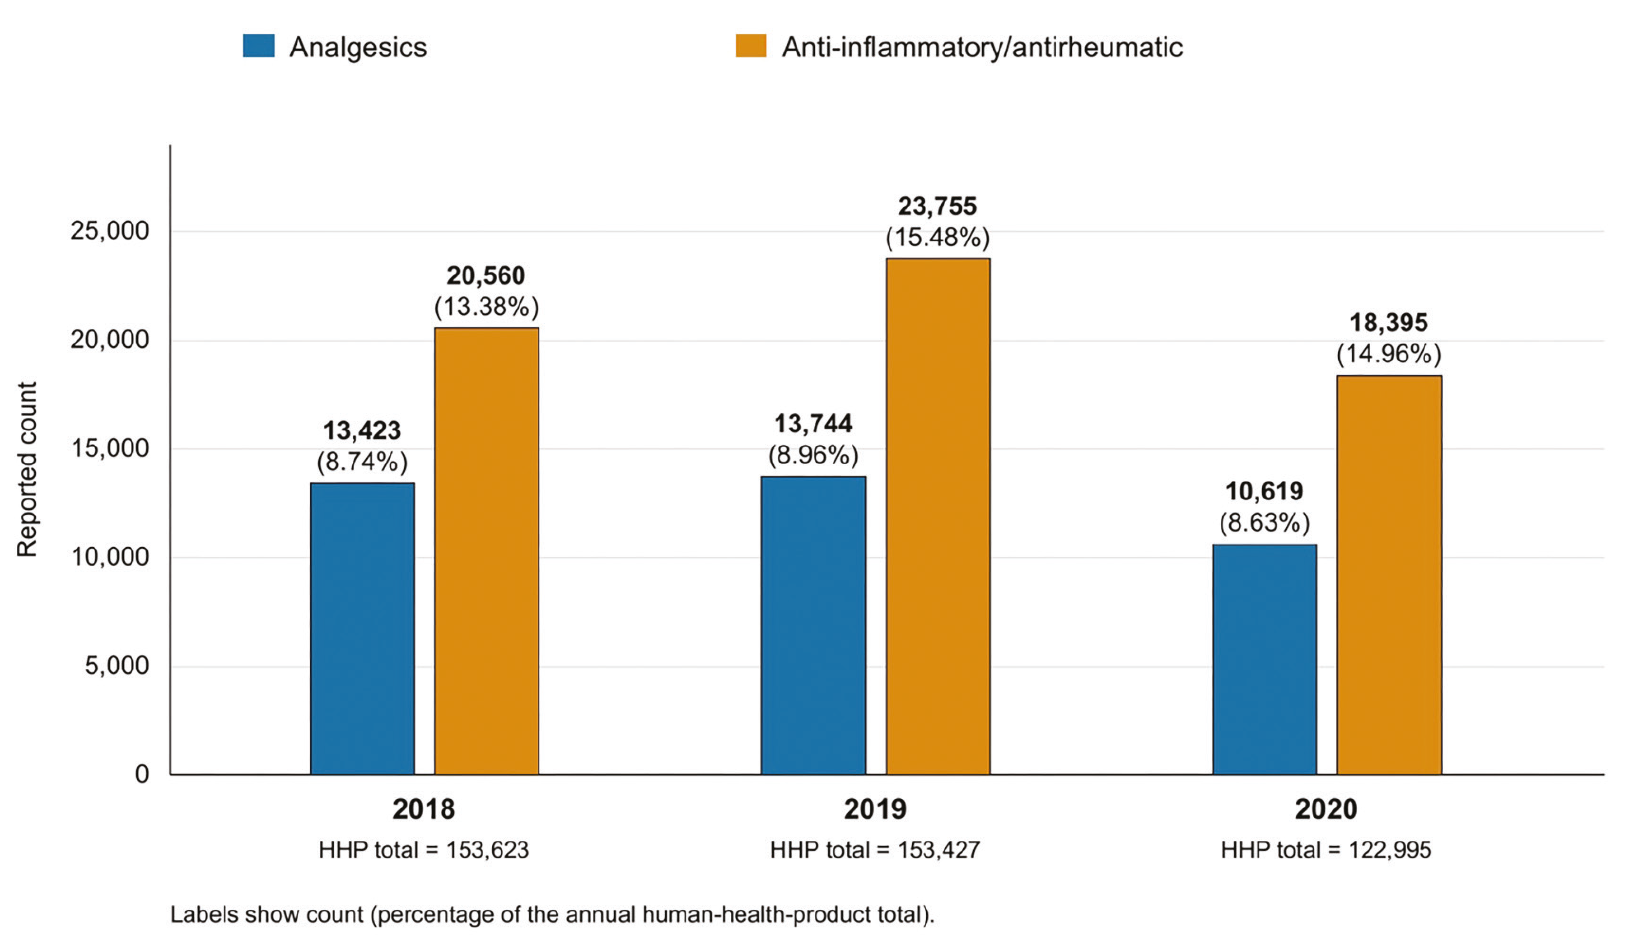
Annual group counts and within-medicine percentages
Bars show the reported count for each UZEM medication group in each year. Labels give the count and, in parentheses, its percentage of the annual human-health-product total, calculated as 100× group count/annual total and rounded to two decimals. The denominators are 153,623 (2018), 153,427 (2019), and 122,995 (2020). Supplementary Material 7 also provides the all-case denominators and corresponding percentages. Counts come from UZEM source Tables 12, 44, and 69, and human-health-product totals from UZEM source Tables 11, 42, and 67 (5). The groups are shown separately. Consistent published labels do not establish that the underlying coding rules remained unchanged
UZEM: National Poison Center
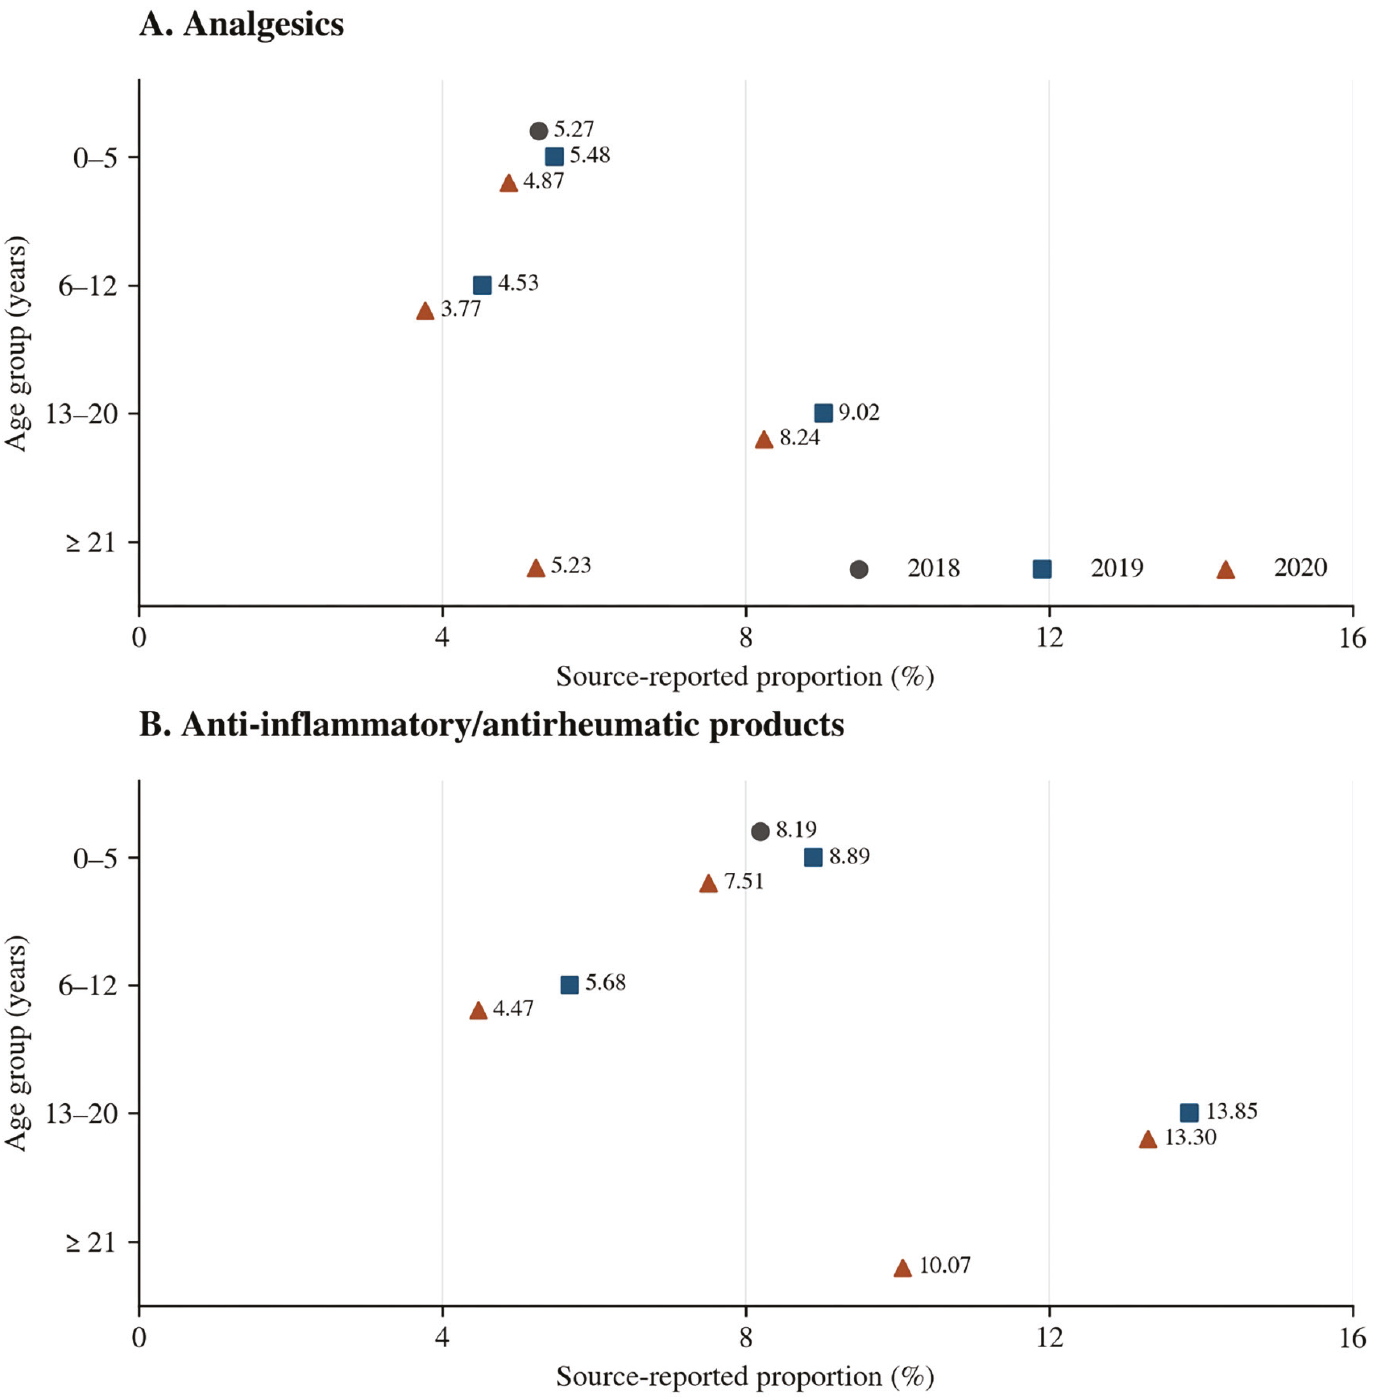
Source-reported within-age-group percentages by medicine group and year
Each percentage uses all source-defined cases in the stated year and age group as its denominator. The values are taken from the source, and the same scale is used in both panels. For ages 0-5, the explicit totals are 61,272 in 2018 and 49,656 in 2020. Totals for the other cited age tables were not printed and were not reconstructed. Symbols for different years are offset vertically; an absent symbol indicates an unavailable stratum. Only ages 0-5 are shown for 2018, and ages ≥21 are available only for 2020. Source: UZEM Tables 22, 46-48, 71-73, and 91; UZEM source Table 92 provides a cross-check for ages 0-5 in 2020 (5). Counts and source locations appear in Supplementary Material 3. These percentages describe the composition of reported cases and cannot be interpreted as population risk
UZEM: National Poison Center
Unreported denominators remained missing and were not reconstructed from rounded percentages. Calculations and verification used Python 3.12.14 (Python Software Foundation, United States).
Results
Availability and source discrepancies, 2014-2020
All-case and human-health-product totals were reported for 2014-2020. General distributions for both target groups and general agent rankings were identified for 2018-2020 only (). Earlier material consisted of retrospective totals and topic-specific tables. General annual paracetamol counts for 2014-2017 were not identified. Among 24 core tables, five repeated full-distribution counts in top lists. Other entries had matching counts but different labels or denominators; their record overlap was undocumented.
retains the retrospective all-case totals from both locations where the annual report and appendix differ. The compendium provides no explanation. The largest difference was 38 cases in 2015, equal to 0.0188% of that year’s UZEM source total of 201,646; all four differences were below 0.02%. The foreword mentions a detailed 2017 activity report, but the compendium contains no corresponding annual chapter ().
Table 1. Conflicting source-reported all-case totals, 2014-2017
Year | Source Table 1: reported cases | Source Table 101: reported cases | Calculated difference |
|---|---|---|---|
2014 | 199,679 | 199,681 | -2 |
2015 | 201,646 | 201,608 | +38 |
2016 | 218,025 | 218,010 | +15 |
2017 | 213,534 | 213,533 | +1 |
Units: All UZEM source-defined cases, not medication-group counts. Both totals are reproduced from the source. The author calculated the difference as UZEM source Table 1 minus UZEM source Table 101 and retained both versions without choosing a corrected total. Source: UZEM Table 1, PDF/printed page 38/7; Table 101, 428/397 (5). Additional early-year values and source percentages are retained in Supplementary Material 2. UZEM: national poison center, PDF: Portable document format | |||
UZEM source Table 186, within the L-thyroxine appendix, describes all 213,534 UZEM cases in 2017 and uses age bands that differ from those in later target-group tables. Source locations and values are recorded in ().
Contextual profile of all UZEM cases
All-case totals were 217,323 in 2018, 217,936 in 2019, and 187,528 in 2020; the last represented a 13.95% decrease from 2019. In the 2019–2020 service tables, incoming calls fell from 364,183 to 334,441 (8.17%), while the proportion answered increased from 91.81% to 93.56%. Calls measure telephone activity and are distinct from cases. Broader demographic, monthly, geographic, and exposure-circumstance distributions were not linked to either medicine group ().
Broader-population clinical information was available: UZEM source Table 65 reports severity for all 187,528 cases in 2020, including 28,222 (15.05%) coded unknown, and UZEM source Table 87 reports severity for ages 0–5. Neither links severity to either target medication group ().
Analgesics and anti-inflammatory products, 2018-2020
In 2018, analgesics accounted for 13,423 records (6.18% of 217,323 all-case units), and anti-inflammatory/antirheumatic products for 20,560 (9.46%). In 2019 the counts were 13,744 (6.31% of 217,936) and 23,755 (10.90%); in 2020 they were 10,619 (5.66% of 187,528) and 18,395 (9.81%) (). displays counts with within-human-health-product percentages; gives both sets of annual denominators and percentages.
The secondary arithmetic summary used 37,786 analgesic and 62,710 anti-inflammatory/antirheumatic records over 622,787 summed annual all-case units, yielding 6.07% and 10.07%, respectively. Repeated top-list entries were excluded from these sums. The summed denominator was not deduplicated across years, and the two medication groups were not combined.
Additional categories remained separate. In 2018, 2019, and 2020, skeletal muscle relaxants accounted for 4,054, 3,393, and 2,659 records; topical joint/muscle pain products for 320, 294, and 263; and the source category “opiates” for 95, 72, and 71. These records were not added to either target group ().
The analgesic count increased by 2.39% from 2018 to 2019, while all-case units increased by 0.28%. From 2019 to 2020, reported analgesic records decreased by 22.74%, and all-case units decreased by 13.95%. Analgesic percentages were 6.31% and 5.66% of all-case units in 2019 and 2020, compared with 8.96% and 8.63% of human-health-product records.
Anti-inflammatory/antirheumatic counts increased by 15.54% in 2019 and decreased by 22.56% in 2020; the category ranked first within each annual group distribution.
Within-year product and agent descriptions
Paracetamol was the highest-ranked explicitly named single ingredient in 2018, second overall behind “other cold preparations,” and first in each later mixed list. reports the entries with each source’s population and salt-specific labels. The 2018 human-health-product list and the later mixed lists had different category definitions and denominators.
Table 2. Selected source-reported agent counts by source year
Year | Source label | Reported count |
|---|---|---|
2018 (15) | Paracetamol | 7,988 |
2018 (15) | Diclofenac diethylammonium salt | 5,339 |
2018 (15) | Dexketoprofen trometamol | 4,027 |
2018 (15) | Ibuprofen | 2,291 |
2018 (15) | Flurbiprofen | 2,332 |
2018 (15) | Naproxen | 2,188 |
2019 (43) | Paracetamol | 8,504 |
2019 (43) | Diclofenac | 5,109 |
2019 (43) | Dexketoprofen | 4,537 |
2019 (43) | Ibuprofen | 2,455 |
2019 (43) | Flurbiprofen | 2,042 |
2019 (43) | Naproxen | 2,024 |
2020 (68) | Paracetamol | 6,648 |
2020 (68) | Diclofenac | 4,175 |
2020 (68) | Dexketoprofen | 3,790 |
2020 (68) | Ibuprofen | 1,482 |
2020 (68) | Flurbiprofen | 1,553 |
2020 (68) | Naproxen | 1,854 |
Scope: Descriptive selection; additional entries remain in Supplementary Material 4. All counts are source-reported aggregate records. No pooled counts, annual changes, or calculated percentages are presented. Row order is not a rank. Source-list populations are 153,623 human-health-product records in 2018, 217,936 all UZEM cases in 2019, and 187,528 all UZEM cases in 2020; these are not totals of displayed rows. The 2018 ATC-named list differs from the mixed product/agent/poison-group lists in 2019-2020. Salt-specific and unspecified labels are retained separately. Rows do not form a harmonized longitudinal series. Original labels, positions, percentages, and locations are in Supplementary Material 4; omission from a truncated list does not mean zero records. Source: UZEM Tables 15, 43, and 68 (5). ATC: Anatomical Therapeutic Chemical classification, UZEM: National poison center | ||
Ibuprofen-combination and single-ingredient entries are reported separately in . An explicit acetaminophen, pamabrom, and pyrilamine combination had 2,704 records in 2018. The paracetamol-related labels in 2019 (,620) and 2020 (,969) did not specify the same ingredients. No combined total was calculated for these entries.
The 2018 table separated 1,237 antithrombotic and 824 analgesic acetylsalicylic-acid records; the 2019 and 2020 lists used a function-unspecified row (1,285 and 1,155). The 2020 age 0–5 human-health table separated antithrombotic (337; ATC B01AC06) and analgesic (151; ATC N02BA01) records. These entries are presented separately.
Metamizole, tramadol, and codeine had no explicit row in the general top-50 lists. Feniramidol and etodolac entries are retained in ; allocation to a specific published poison-group total was not documented.
Age-specific findings
For ages 0-5, analgesic counts were 3,229 (5.27% of all 0-5-year case units) in 2018, 3,376 (5.48%) in 2019, and 2,417 (4.87%) in 2020. Corresponding anti-inflammatory/antirheumatic counts were 5,021 (8.19%), 5,475 (8.89%), and 3,728 (7.51%) ().
In 2020, 49,656 cases and 26,663 human-health-product records were reported for ages 0-5 years. Analgesics constituted 9.06% and anti-inflammatory and antirheumatic products 13.98% of human-health-product records. In the age-specific agent table, acetaminophen accounted for 2,003 records, diclofenac diethylamine for 1,466, and ibuprofen for 732. These findings describe only the pediatric subgroup.
Reported analgesic percentages for ages 6-12 were 4.53% in 2019 and 3.77% in 2020; for ages 13-20 they were 9.02% and 8.24%. Ages ≥21 were separately tabulated only in 2020 (5.23%). Among strata published in both years, ages 13-20 had the largest within-case percentages for both groups. Several age denominators were unprinted ().
The 2020 age counts summed to 10,608 analgesic and 18,373 anti-inflammatory/antirheumatic records, leaving residuals of 11 (0.10%) and 22 (0.12%) relative to general totals. UZEM source Table 58 reported 97 cases with unknown age, but their medication-group allocation was unavailable. The residuals were therefore not attributed to these cases. Missing adult-group data prevented corresponding reconciliation for 2019.
Beyond these age-group tables, no cross-tabulation linked either medication group to sex, province, calendar month, exposure circumstance, exposure setting, caller type, route, clinical severity, treatment, hospitalization, or outcome. Mean or median age for either target group was unavailable.
Critical appraisal and international mapping findings
The appraisal classified general target-group distributions for 2014-2017 as not identified, clinical information as broader-population only, and several agent definitions or denominators as insufficiently defined. Coding stability across 2018-2020 was undocumented. records the retrospective-total discrepancies; links each appraisal domain to source evidence. connects the documented differences to the decisions used in this analysis and the reporting information needed for further comparisons.
Table 3. Source evidence, analytical decisions, and reporting priorities
Documented source feature | Decision used in this analysis | Information needed for further use |
|---|---|---|
General target-group distributions identified for 2018-2020 only; earlier retrospective totals differ slightly | Restrict general group descriptions to 2018-2020; retain both discrepant early-year values | Explicit annual coverage and a source correction log |
Group labels persist but coding stability is undocumented; agent lists mix classification levels | Retain original categories; keep combinations, salts and function-specific labels separate | Versioned product-ingredient–group definitions and a validated crosswalk |
Five top-list tables repeat full-distribution counts; overlap of other records is unresolved | Exclude repeated published entries from sums; do not claim person- or episode-level deduplication | Explicit counting units and repeat-contact, episode and multi-agent identifiers |
Annual all-case and human-health-product denominators differ; age strata are incomplete | Report both annual denominators; retain pooled values only as secondary arithmetic summaries | Table-specific denominators, compatible age bands and explicit missingness |
Severity and other clinical information concern broader populations rather than the target groups | Do not assign all-case demographics or clinical outcomes to either medication group | Medication-group linkage to dose, intent, severity, treatment, disposition and outcome |
Three annual group observations; reporting and coding continuity unverified | Describe annual changes without trend tests, population-incidence estimates or causal attribution | Longer consistently coded series and suitable population or medicine-use denominators |
Source evidence derives from the public UZEM compendium (5) and the inventory in Supplementary Material 2. Analytical decisions describe this study; reporting priorities are proposals for future evaluation, not validated improvements or demonstrated clinical benefits. UZEM: National poison center
The international sources used different units, including contacts, exposures, and treated poisonings (). Their medicine-group definitions, denominators, and clinical populations also differed. No pooled international estimate or national risk ranking was calculated.
Discussion
Principal findings and contribution
The appraisal addresses a secondary-research question: which medication-group comparisons can be supported by the published UZEM tables? Its contribution is the source-linked justification of analytical choices and their consequences for interpretation. General group distributions support separate descriptions for 2018-2020, whereas earlier topic-specific tables do not extend that series. The denominator example below and make these decisions explicit so that readers can assess the basis and limits of each comparison.
The study’s strengths are its source-referenced inventory, explicit denominator mapping, and executable checks of extraction and arithmetic. connects documented source features to decisions actually used: retaining function- and combination-specific agent entries separately, excluding repeated published entries from sums without claiming person-level deduplication, reporting both annual denominators, and withholding group-specific clinical interpretations when only broader-population information is available. These decisions define what is being counted and which inferences the summaries can support. The accompanying extracts and code allow readers to examine the decisions alongside the numerical results. This is a reproducible secondary appraisal; it does not introduce a new surveillance dataset or a validated general method.
Comparison with previous studies
Hocaoglu et al. () reported 7,939 analgesic exposures in the İzmir series from 1993–2004, with paracetamol accounting for 47.9%. Their analgesic category included NSAIDs and used different reporting populations from the separate UZEM categories. Eluri et al. () analyzed medication-error reports with defined eligibility criteria, population denominators, and clinical outcomes. These studies illustrate distinct research questions and cannot serve as direct numerical benchmarks for the UZEM group percentages.
The NPDS reports distinguish human exposures, information requests, and medical outcomes (-). The Australian report separates calls, including repeated contacts, from exposure events (). The Jordanian study records drug-related inquiries and clinical features (), while the Brazilian study uses distinct mortality, hospitalization, and notification sources (). Major et al. () calculated rates using reporting-setting, population, and drug-distribution denominators, with patterns depending on denominator choice. These examples show why explicit units and denominators matter; their differing populations preclude direct numerical benchmarking against UZEM.
Age-specific studies also require careful matching of eligibility criteria. Babić et al. () examined unintentional ingestions among preschool children, whereas Weigel et al. () analyzed single-substance acetaminophen and ibuprofen self-poisoning among adolescents. The published UZEM age strata do not provide these group-specific exposure circumstances or outcomes. Their percentages therefore describe the composition of reported cases, not age-specific population risk or suicidal intent.
Karami et al. () used monthly poison-center data and interrupted time-series analyses to examine pediatric non-prescription analgesic/antipyretic exposures before and during the pandemic. Their longer series and defined exposure circumstances illustrate the information needed for temporal analyses. Three annual UZEM aggregates cannot provide an equivalent analysis or establish the reason for the 2020 decrease.
Implications for secondary research and reporting
Denominator choice illustrates the appraisal’s added interpretation. The 22.74% decrease in analgesic records between 2019 and 2020 accompanied a change from 8.96% to 8.63% among human-health-product records, compared with 6.31% to 5.66% among all-case units. Thus, the raw-count decrease and the composition of reports answer different questions. Presenting both denominators makes this distinction explicit. Neither description establishes population incidence, a reliable temporal trend, or the cause of the 2020 change.
Pooled percentages weight each year by its reported all-case denominator. They remain secondary arithmetic summaries because repeat contacts, multiple substances, and overlap across years cannot be resolved. Excluding repeated published entries prevents double-counting those entries; it does not create a deduplicated population of individuals or episodes. Annual estimates therefore remain primary.
translates the observed reporting differences into limited, testable priorities: explicit counting units and denominators, versioned product–ingredient–group definitions, compatible age strata, and clinical fields linked to medication groups. WHO guidance and standardized severity reporting offer relevant reference points (,). Consistently coded series and compatible population or medicine-use denominators would be prerequisites for future rate analyses; ATC/DDD methods may inform medicine-use denominators (). Linkage completeness, classification validity, and any benefit to emergency care would require separate evaluation.
Study Limitations
Passive consultation-based reporting and unresolved repeat contacts or multiple-agent records prevent population-incidence estimates and reliable temporal inference. Unverified coding continuity also limits annual comparisons. The data cannot establish the cause of the 2020 decrease; absence from a truncated list does not establish zero exposure.
Group-linked sex, clinical outcomes, and individual ages were unavailable, and several age denominators were missing. These published-data limitations do not establish absent clinical assessment in the underlying database. The small early-year discrepancies do not affect the 2018–2020 estimates.
This purposive, retrospective appraisal concerns one public compendium and cannot characterize the current UZEM database. Its domains and comparator selection were unregistered and unvalidated. Source matching supports extraction and arithmetic, not clinical ascertainment or coding validity.
Conclusion
The source-linked appraisal documented the basis for annual medication-group descriptions in 2018-2020 and the denominator, classification, and clinical-linkage constraints on further comparisons. It distinguished reproducible descriptive summaries from analyses that require information absent from the published compendium.
Ethics
Ethics Committee Approval: This secondary analysis used a publicly available government report containing anonymous, aggregated data. It involved no individual health records, participant contact, intervention, or identifiable personal information. Ethics committee approval was not obtained, and no formal exemption was sought or granted.
Informed Consent: Not applicable; only publicly available anonymous aggregate data were used.
Footnotes
Acknowledgments
The author thanks Prof. Dr. Erdem Karabulut, Department of Biostatistics, Faculty of Medicine, Hacettepe University, for independently checking the original manuscript and supplementary data without errors requiring correction. The author confirmed both this check and permission for the acknowledgment on 1 October 2026. This does not represent independent review of newly added text or analyses.
The abstract entitled “Analgesic and Anti-Inflammatory/Antirheumatic Exposure Reporting in Türkiye: A National Poison Center Appraisal” (OP-177) was presented orally at the 6th International Emergency Medicine Congress, held on 23-26 October 2026 at Rixos Sungate Hotel, Antalya, Türkiye. The oral presentation took place on 25 October 2026.
Verification assistance covered label/count/percentage checks, explicit-denominator recalculation, full-distribution totals, source hashes, and executable code; the 7 October 2026 verification results are reported in Supplementary Material 5.
The public UZEM compendium is the source (). Supplementary Materials 2-4, 6, and 7 provide source-linked extracts; the supplied verification code and data files reproduce current checks. No individual database records were accessed.
Financial Disclosure
The author declared that this study received no financial support.
References
Hocaoglu N, Kalkan S, Akgun A, Capar S, Tuncok Y. A retrospective evaluation of analgesic exposures from Izmir, Turkey. Hum Exp Toxicol. 2007;26(8):629-636.
Eluri M, Spiller HA, Casavant MJ, Chounthirath T, Conner KA, Smith GA. Analgesic-related medication errors reported to US poison control centers. Pain Med. 2018;19(12):2357-2370.
International Programme on Chemical Safety, World Health Organization. Toxicovigilance [Internet]. Geneva: World Health Organization; 2012 [cited 2026 Oct 13]. Available from: https://www.who.int/publications/m/item/toxicovigilance
World Health Organization. Guidelines for establishing a poison centre [Internet]. Geneva: World Health Organization; 2020 [cited 2026 Sep 8]. Available from: https://www.who.int/publications/i/item/9789240009523
Ulusal Zehir Danışma Merkezi (UZEM). Ulusal Zehir Danışma Merkezi (UZEM) Raporları 2014–2020 Yılları [National Poison Center (UZEM) reports, 2014-2020] [Internet]. Ankara: T.C. Sağlık Bakanlığı Halk Sağlığı Genel Müdürlüğü; 2021 [cited 2026 Oct 13]. Available from: https://hsgm.saglik.gov.tr/depo/Yayinlarimiz/Raporlar/Ulusal_Zehir_Danisma_Merkezi_UZEM_Raporlari_2014-2020_Yillarr.pdf
Brass EP, Burnham RI, Reynolds KM. Poison center exposures due to therapeutic misuse of nonprescription acetaminophen-containing combination products in the United States 2007-2016. Clin Toxicol (Phila). 2019;57(5):350-355.
Marano M, Roversi M, Severini F, Memoli C, Musolino A, Pisani M, et al. Adverse drugs reactions to paracetamol and ibuprofen in children: a 5-year report from a pediatric poison control center in Italy. Ital J Pediatr. 2023;49(1):20.
Apata J, Pennap DD, Mosholder AD. The use of analgesics for intentional self-poisoning: trends in U.S. poison center data. J Psychiatr Res. 2023;163:402-405.
Cairns R, Brown JA, Wylie CE, Dawson AH, Isbister GK, Buckley NA. Paracetamol poisoning-related hospital admissions and deaths in Australia, 2004-2017. Med J Aust. 2019;211(5):218-223.
von Elm E, Altman DG, Egger M, Pocock SJ, Gøtzsche PC, Vandenbroucke JP; STROBE Initiative. The Strengthening the Reporting of Observational Studies in Epidemiology (STROBE) statement: guidelines for reporting observational studies. Ann Intern Med. 2007;147(8):573-577.
Benchimol EI, Smeeth L, Guttmann A, Harron K, Moher D, Petersen I, et al. The reporting of studies conducted using observational routinely-collected health data (RECORD) statement. PLoS Med. 2015;12(10):e1001885.
Gummin DD, Mowry JB, Spyker DA, Brooks DE, Beuhler MC, Rivers LJ, et al. 2018 annual report of the American association of poison control centers’ national poison data system (NPDS): 36th annual report. Clin Toxicol (Phila). 2019;57(12):1220-1413.
Gummin DD, Mowry JB, Beuhler MC, Spyker DA, Brooks DE, Dibert KW, et al. 2019 annual report of the American association of poison control centers’ national poison data system (NPDS): 37th annual report. Clin Toxicol (Phila). 2020;58(12):1360-1541.
Gummin DD, Mowry JB, Beuhler MC, Spyker DA, Bronstein AC, Rivers LJ, et al. 2020 annual report of the American association of poison control centers’ national poison data system (NPDS): 38th annual report. Clin Toxicol (Phila). 2021;59(12):1282-1501.
Huynh A, Cairns R, Brown JA, Lynch AM, Robinson J, Wylie C, et al. Patterns of poisoning exposure at different ages: the 2015 annual report of the Australian poisons information centres. Med J Aust. 2018;209(2):74-79.
Yehya A, Albals D, Issa R, Fawadleh A. Retrospective assessment of acute poisoning incidents by pharmaceutical agents in Jordan: data from Pharmacy One Poison Call Center, 2014 to 2018—Part II. Pharmacol Res Perspect. 2020;8(2):e00583. doi:10.1002/prp2.583.
Okuyama JHH, Galvao TF, Silva MT. Estimates of paracetamol poisoning in Brazil: analysis of official records from 1990s to 2020. Front Pharmacol. 2022;13:829547. doi:10.3389/fphar.2022.829547.
Major JM, Zhou EH, Wong HL, Trinidad JP, Pham TM, Mehta H, et al. Trends in rates of acetaminophen-related adverse events in the United States. Pharmacoepidemiol Drug Saf. 2016;25(5):590-598.
Babić Ž, Benco Kordić N, Rešić A, Turk R. Characteristics of unintentional ingestion of oral non-steroidal anti-inflammatory drugs and analgesics in preschool children. Arh Hig Rada Toksikol. 2021;72(4):299-304.
Weigel B, Adams A, Wahrenbrock T, Wahl M. Adolescent acetaminophen and ibuprofen self-poisoning, 2017-2022. Pediatr Emerg Care. 2024;40(11):776-780.
Karami S, Asonye C, Pinnow E, Pratt V, McCulley L, Dwumfour N, et al. Trends in pediatric nonprescription analgesic/antipyretic exposures during the COVID-19 pandemic. Clin Toxicol (Phila). 2023;61(3):190-199.
Persson HE, Sjöberg GK, Haines JA, Pronczuk de Garbino J. Poisoning severity score. Grading of acute poisoning. J Toxicol Clin Toxicol. 1998;36(3):205-213.
World Health Organization. ATC/DDD toolkit: applications of the ATC/DDD methodology [Internet]. Geneva: World Health Organization [cited 2026 Oct 13]. Available from: https://www.who.int/tools/atc-ddd-toolkit/applications-methodology