
Abstract
Aims: This study aimed to identify the admission clinical variables independently associated with in-hospital mortality among patients with head trauma.
Methods: This prospective, multicentre, observational study was conducted at four emergency departments in Central Java, Indonesia. Patients presenting with head trauma were consecutively enrolled, while those aged younger than 15 years, dead on arrival, transferred before an in-hospital outcome could be ascertained, or with incomplete admission records were excluded. The primary endpoint was in-hospital mortality. Six admission variables age, Glasgow Coma Scale score, injury severity score, intracranial haemorrhage on computed tomography, hypotension, Glasgow Coma scale (GCS) and pupillary status were simultaneously entered into a multivariable logistic regression model.
Results: A total of 657 patients (mean age, 42.9±16.2 years; 69.1% male) were included in the analysis, of whom 112 (17.0%) died during hospitalisation. Four admission variables were independently associated with in-hospital mortality: older age [adjusted odds ratio (OR) 1.04 per year, 95% confidence interval (CI) 1.02-1.06; p<0.001], lower GCS score (adjusted OR 0.62 per point, 95% CI 0.55-0.70; p<0.001), higher injury severity score (adjusted OR 1.08 per point, 95% CI 1.05-1.11; p<0.001), and abnormal pupillary status (adjusted OR 3.86, 95% CI 1.82-8.19; p<0.001). Intracranial haemorrhage and hypotension were not independently associated with mortality after adjustment. The combined model demonstrated excellent discrimination, with an area under the receiver-operating-characteristic curve of 0.91 (95% CI 0.88-0.94).
Conclusions: This study demonstrated that older age, a lower GCS score, a higher injury severity score, and abnormal pupillary reactivity at emergency-department admission were independently associated with in-hospital mortality after head trauma.
Keywords: Head trauma, traumatic brain injury, in-hospital mortality, Glasgow Coma Scale, emergency department
Introduction
Traumatic brain injury remains one of the leading causes of death and long-term disability worldwide, imposing a disproportionate burden on young, economically productive individuals and on health systems in low- and middle-income countries, where road-traffic collisions and falls are common mechanisms of injury (,,,). Despite advances in neurocritical care, a substantial proportion of patients with head trauma die during their hospital stay, and the emergency department (ED) is the setting in which the earliest and most consequential decisions triage, resuscitation priority, neurosurgical referral, and family counselling must be made, often before advanced investigations are available (,,). Reliable identification, at the moment of admission, of patients at high risk of death is therefore central to rational resource allocation and to realistic prognostic communication.
Clinicians have long relied on individual markers of severity to gauge outcome after head trauma. The Glasgow Coma Scale (GCS) quantifies the depth of impaired consciousness; the injury severity score (ISS) summarises overall anatomical injury burden; and findings such as intracranial haemorrhage on computed tomography, systemic hypotension, and abnormal pupillary reactivity are each recognised indicators of a poor prognosis (,,,,,,,,,,). Established prognostic instruments, notably the CRASH and IMPACT models, have integrated several of these variables to estimate outcome after traumatic brain injury (,). These tools have advanced the field considerably, yet important limitations remain for everyday emergency practice.
First, the most widely cited prognostic models were derived predominantly from large cohorts and clinical trials conducted in high-income settings, and their calibration in resource-limited EDs where case mix, pre-hospital care, and time-to-imaging differ substantially is uncertain (). Second, several models incorporate variables that are not consistently available at the point of first assessment in such settings, limiting their bedside applicability. Third, much of the local evidence examines predictors in isolation rather than quantifying their combined, independent contribution within a single multivariable model applicable to a real ED population. Consequently, there is a practical gap: emergency clinicians in many settings lack a parsimonious, locally relevant model built entirely from information routinely obtained on arrival.
This study addresses that gap not by proposing a new scoring system, but by providing prospective, multicentre evidence from a resource-limited Southeast Asian setting that remains substantially underrepresented in the cohorts from which the most widely used prognostic models were derived. Its contribution is threefold: it examines whether established admission predictors retain their prognostic value when combined in a single, parsimonious model in this context; it deliberately restricts the model to six variables that are universally available at the point of first contact without laboratory, advanced imaging, or specialist input so that it is applicable in EDs where more complex instruments such as the CRASH and IMPACT models are impractical; and it integrates physiological (GCS, hypotension, pupillary reactivity), anatomical (ISS), and imaging (intracranial haemorrhage) domains into one admission-time framework, quantifying the independent weight of each readily available predictor and the discriminative and calibration performance of the combined model in a population where such data are scarce (,,,).
Accordingly, the objectives of this study were: () to identify the admission clinical variables independently associated with in-hospital mortality among patients presenting with head trauma to the ED, and () to estimate the strength of these associations, expressed as adjusted odds ratios (ORs), using a binary logistic regression model. We hypothesised that a lower GCS, higher ISS, the presence of intracranial haemorrhage, hypotension, and abnormal pupillary reactivity would be independently associated with increased odds of in-hospital death.
Methods
Study design and setting
This study was designed as a prospective, multicentre, observational cohort study. It was conducted at four hospitals between June 2025 and May 2026, in Central Java, Indonesia, comprising one tertiary referral and teaching hospital and three secondary district general hospitals in the Banyumas-Kebumen-Purworejo-Cilacap region. Together, these centres serve both urban and rural populations and receive head-trauma patients through direct presentation and inter-facility referral.
Study population
Consecutive patients presenting with head trauma to the EDs of the participating centres during the study period were assessed for eligibility. Patients were eligible for inclusion if they were aged 15 years or older. No restriction was placed on the time interval between injury and presentation, so that the cohort would reflect the full range of patients encountered in routine emergency practice. Patients were excluded if they were younger than 15 years, were dead on arrival, were transferred before an in-hospital outcome could be ascertained, or had incomplete admission records. Each eligible patient was enrolled only once, at the index presentation, and followed until hospital discharge or in-hospital death. No post-discharge follow-up was performed.
Sample size
The required sample size was calculated using the criteria proposed by Martin et al. () for developing a clinical prediction model with a binary outcome, as implemented in the pmsampsize package. The calculation assumed six candidate predictor parameters, an anticipated in-hospital mortality of 15% based on preliminary data, and a conservatively anticipated model discrimination (C-statistic) of 0.80, corresponding to an approximate Cox-Snell R2 of 0.15. Applying the criteria of an expected shrinkage of at least 0.90, an absolute difference between the apparent and adjusted Nagelkerke R2 of no more than 0.05, and precise estimation of the overall outcome risk, the minimum required sample size was 329 patients; the binding criterion was the minimisation of overfitting (expected shrinkage), and at the anticipated 15% mortality this corresponded to approximately 49 events (about 8 events per predictor parameter). To also satisfy the conventional benchmark of at least ten events per predictor parameter and to allow for participant exclusions and incomplete records, the target enrolment was increased to approximately 500 patients (approximately 75 anticipated events), distributed across the four participating centres (approximately 125 per centre). The achieved analytical sample of 657 patients, including 112 deaths (17.0%), exceeded this target and corresponded to approximately 18.7 events per predictor parameter.
Data collection, variables, and inter-rater reliability
Data were collected at the point of ED admission using a standardised, pre-piloted case-report form applied uniformly across all centres. The dependent variable was in-hospital mortality, defined as death occurring at any time between admission and hospital discharge and coded as a binary outcome (1= died, 0= survived to discharge). Six predictor variables, all recorded on arrival, were examined: age (years); the GCS score on admission (3,4,5,6,7,8,9,10,11,12,13,14,15); the ISS (1,2,3,4,5,6,7,8,9,10,11,12,13,14,15,16,17,18,19,20,21,22,23,24,25,26,27,28,29,30,31,32,33,34,35,36,37,38,39,40,41,42,43,44,45,46,47,48,49,50,51,52,53,54,55,56,57,58,59,60,61,62,63,64,65,66,67,68,69,70,71,72,73,74,75); the presence of intracranial haemorrhage on head computed tomography (1= present, 0= absent); hypotension, defined as an admission systolic blood pressure below 90 mmHg (1= present, 0 = absent); and pupillary status (1= abnormal, i.e. anisocoria or a non-reactive pupil; 0= normal, i.e., isocoric and reactive pupils). Intracranial haemorrhage was recorded as the presence of any traumatic intracranial haemorrhage on head computed tomography, without differentiation into specific subtypes (e.g., epidural, subdural, subarachnoid, or intraparenchymal haemorrhage). To ensure comparability across sites, the GCS score, pupillary status, and ISS were assessed using standardized definitions by trained clinicians, and computed tomography findings were interpreted according to a common protocol. Inter-rater reliability was assessed on a random subset of 35 patients independently evaluated by five expert raters. Agreement was quantified using Fleiss’ kappa for pupillary status and for intracranial haemorrhage on computed tomography, and using a weighted kappa for the GCS. Agreement was substantial to almost perfect: substantial for pupillary status [κ=0.76; 95% confidence interval (CI) 0.62-0.86], and almost perfect for intracranial haemorrhage (κ=0.81; 95% CI 0.72-0.91) and the GCS (weighted κ=0.83; 95% CI 0.70-0.91).
Statistical Analysis
Statistical analyses were performed using SPSS version 30 (IBM Corp., Armonk, NY, USA), and sample size was calculated using pmsampsize package. Continuous variables were summarised as mean (± standard deviation) and categorical variables as frequency (percentage). Baseline characteristics were compared between survivors and non-survivors using the independent-samples t-test for continuous variables—with the Mann-Whitney U test applied where distributions departed from normality on the Shapiro-Wilk test—and the Pearson χ2 test for categorical variables, with Fisher’s exact test substituted when any expected cell count was below five. The association between each predictor and in-hospital mortality was first quantified using univariable binary logistic regression, after which all six predictors were entered simultaneously into a multivariable binary logistic regression model (enter method). Associations were expressed as crude and adjusted odds ratios (OR and adjusted OR) with 95% CIs. Discrimination was assessed using the area under the receiver-operating-characteristic curve (AUC); explained variation was summarised by the Cox-Snell and Nagelkerke pseudo-R2 statistics, and classification performance was evaluated at a 0.50 probability threshold, with the Youden index used to identify the optimal cut-off. Model calibration was assessed using the Hosmer-Lemeshow goodness-of-fit test and, graphically, using a flexible (lowess-smoothed) calibration curve plotting the observed proportion of deaths against the predicted probability, complemented by risk groups defined by deciles of predicted probability; the calibration intercept and slope were also calculated. A two-sided p-value below 0.05 was considered statistically significant.
Results
Participant characteristics
During the study period, 744 patients presenting with head trauma to the ED were assessed for eligibility. Of these, 87 were excluded—12 patients younger than 15 years, 33 who were dead on arrival, 17 transferred before an in-hospital outcome could be ascertained, and 25 with incomplete admission records—leaving 657 patients in the final analysis (). In-hospital mortality occurred in 112 patients (17.0%), while 545 (83.0%) survived to discharge. The mean age of the cohort was 42.9±16.2 years, and the majority of patients were male (454; 69.1%), with a comparable sex distribution between survivors and non-survivors (p=0.088). Compared with survivors, non-survivors were older (mean 48.0 versus 41.9 years) and presented with a markedly lower admission GCS (mean 7.4 versus 11.7) and a higher ISS (mean 37.5 versus 26.4); a greater proportion of non-survivors also had intracranial haemorrhage on computed tomography (57.1% versus 34.3%) and abnormal pupillary findings (39.3% versus 3.9%). All of these differences were statistically significant (p<0.001). The baseline characteristics of the two groups are presented in .
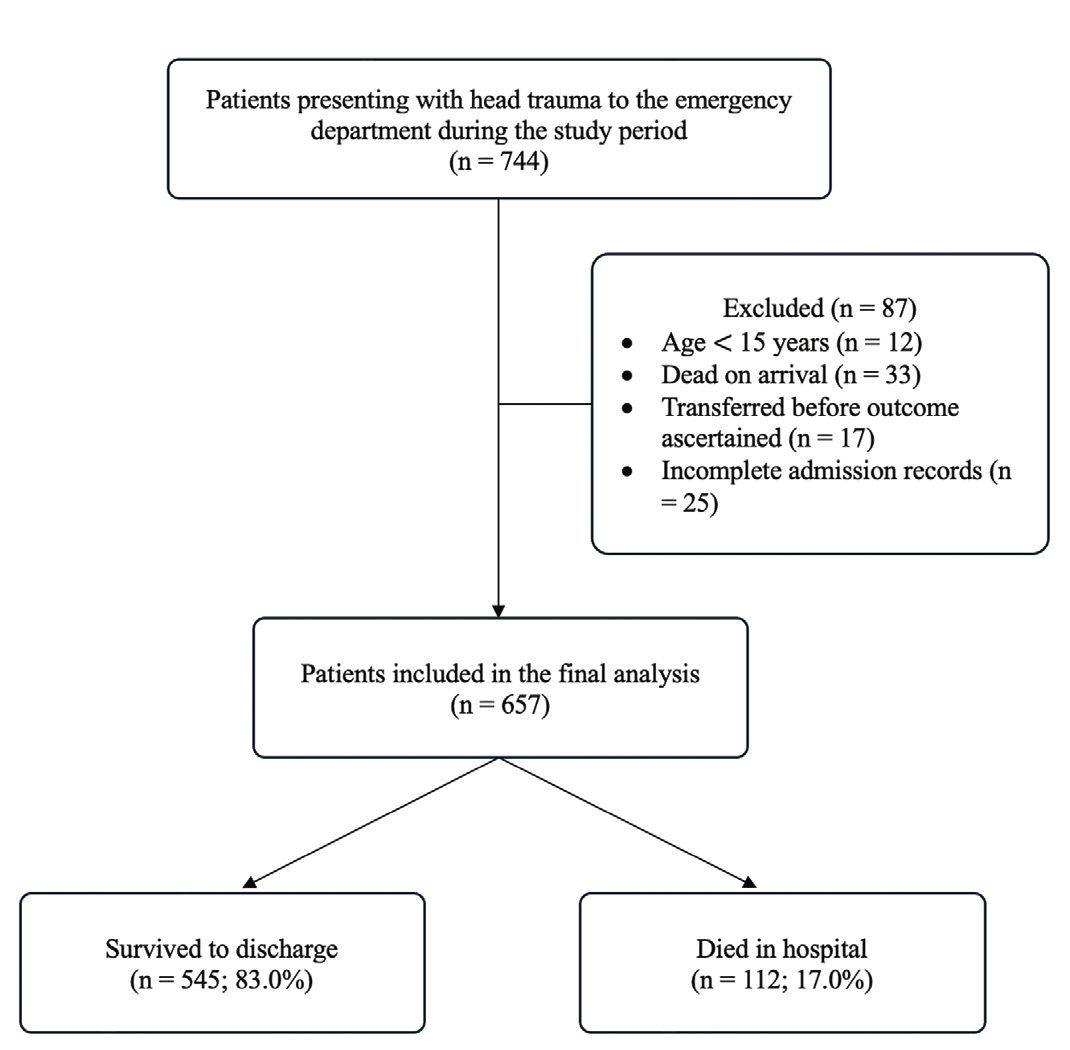
Flow diagram of patient selection and in-hospital outcomes following head trauma
Table 1. Baseline characteristics of patients with head trauma, stratified by in-hospital mortality (n=657)
Characteristic | All patients (n=657) | Survivors (n=545) | Non-survivors (n=112) | p-value |
|---|---|---|---|---|
Age, years, mean (SD) | 42.9 (16.2) | 41.9 (15.8) | 48.0 (16.9) | <0.001 |
Male sex, n (%) | 454 (69.1) | 369 (67.7) | 85 (75.9) | 0.088 |
GCS score, mean (SD) | 11.0 (3.1) | 11.7 (2.6) | 7.4 (2.7) | <0.001 |
ISS, mean (SD) | 28.3 (12.1) | 26.4 (11.3) | 37.5 (11.6) | <0.001 |
Intracranial haemorrhage, n (%) | 251 (38.2) | 187 (34.3) | 64 (57.1) | <0.001 |
Hypotension (SBP <90 mmHg), n (%) | 32 (4.9) | 26 (4.8) | 6 (5.4) | 0.793 |
Abnormal pupillary status, n (%) | 65 (9.9) | 21 (3.9) | 44 (39.3) | <0.001 |
SD: Standard deviation, GCS: Glasgow Coma Scale, ISS: Injury severity score, SBP: Systolic blood pressure. p-values from the independent-samples t-test (continuous variables) or Pearson χ2 test (categorical variables)
Univariable and multivariable analysis
In univariable logistic regression, older age, a lower GCS, a higher ISS, the presence of intracranial haemorrhage, and abnormal pupillary status were each significantly associated with in-hospital mortality, whereas hypotension was not; abnormal pupillary status showed the strongest crude association with death (crude OR 16.15, 95% CI 9.06-28.78; p<0.001). In the multivariable model containing all six admission predictors, four variables remained independently associated with in-hospital mortality: older age (adjusted OR 1.04 per year, 95% CI 1.02-1.06; p<0.001), a lower GCS (adjusted OR 0.62 per point, 95% CI 0.55-0.70; p<0.001), a higher ISS (adjusted OR 1.08 per point, 95% CI 1.05-1.11; p<0.001), and abnormal pupillary status (adjusted OR 3.86, 95% CI 1.82-8.19; p<0.001). After adjustment, neither intracranial haemorrhage (adjusted OR 1.35, 95% CI 0.77-2.36; p=0.294) nor hypotension (adjusted OR 2.11, 95% CI 0.61-7.31; p=0.240) was independently predictive. The crude and adjusted associations are shown in .
Table 2. Univariable and multivariable logistic regression of admission predictors for in-hospital mortality
Predictor | Univariable analysis | Multivariable analysis | ||
|---|---|---|---|---|
Crude OR (95% CI) | p-value | Adjusted OR | p-value | |
Age (per year) | 1.02 (1.01-1.04) | <0.001 | 1.04 (1.02-1.06) | <0.001 |
GCS (per point) | 0.57 (0.51-0.63) | <0.001 | 0.62 (0.55-0.70) | <0.001 |
ISS (per point) | 1.09 (1.07-1.11) | <0.001 | 1.08 (1.05-1.11) | <0.001 |
Intracranial haemorrhage (present vs. absent) | 2.55 (1.69-3.86) | <0.001 | 1.35 (0.77-2.36) | 0.294 |
Hypotension (present vs. absent) | 1.13 (0.45-2.81) | 0.793 | 2.11 (0.61-7.31) | 0.240 |
Abnormal pupillary status (vs. normal) | 16.15 (9.06-28.78) | <0.001 | 3.86 (1.82-8.19) | <0.001 |
OR: Odds ratio, CI: Confidence interval, GCS: Glasgow Coma Scale, ISS: Injury severity score. Adjusted odds ratios were derived from the multivariable model containing all six admission predictors
Model performance
The model demonstrated excellent discrimination, with an AUC of 0.91 (95% CI 0.88-0.94), and explained a substantial proportion of the variation in mortality (Nagelkerke R2 0.55). Calibration on the Hosmer-Lemeshow test was borderline (χ2=15.72, df=8, p=0.047). At a 0.50 probability threshold, the model correctly classified 90.4% of patients, with a specificity of 97.1% and a sensitivity of 58.0% (); at the Youden-optimal threshold of 0.14, sensitivity rose to 89.3% at a specificity of 80.6%. The flexible calibration curve lay close to the line of perfect calibration across most of the probability range, with only minor local deviations, consistent with the borderline Hosmer-Lemeshow result; the apparent calibration slope was 1.00 and the calibration intercept was 0.00 (). Some overestimation was observed in the mid-range probability groups, indicating a modest tendency of the model to over-predict risk in patients of intermediate severity.
Table 3. Performance of the multivariable logistic regression model
Metric | Value |
|---|---|
Discrimination (AUC, 95% CI) | 0.91 (0.88-0.94) |
Calibration (Hosmer-Lemeshow) | χ=15.72, df=8, p=0.047 |
Cox-Snell R | 0.33 |
Nagelkerke R | 0.55 |
Overall correct classification (threshold 0.50), % | 90.4 |
Sensitivity/specificity (threshold 0.50), % | 58.0/97.1 |
Positive/negative predictive value, % | 80.2/91.8 |
AUC: Area under the receiver-operating-characteristic curve, CI: Confidence interval
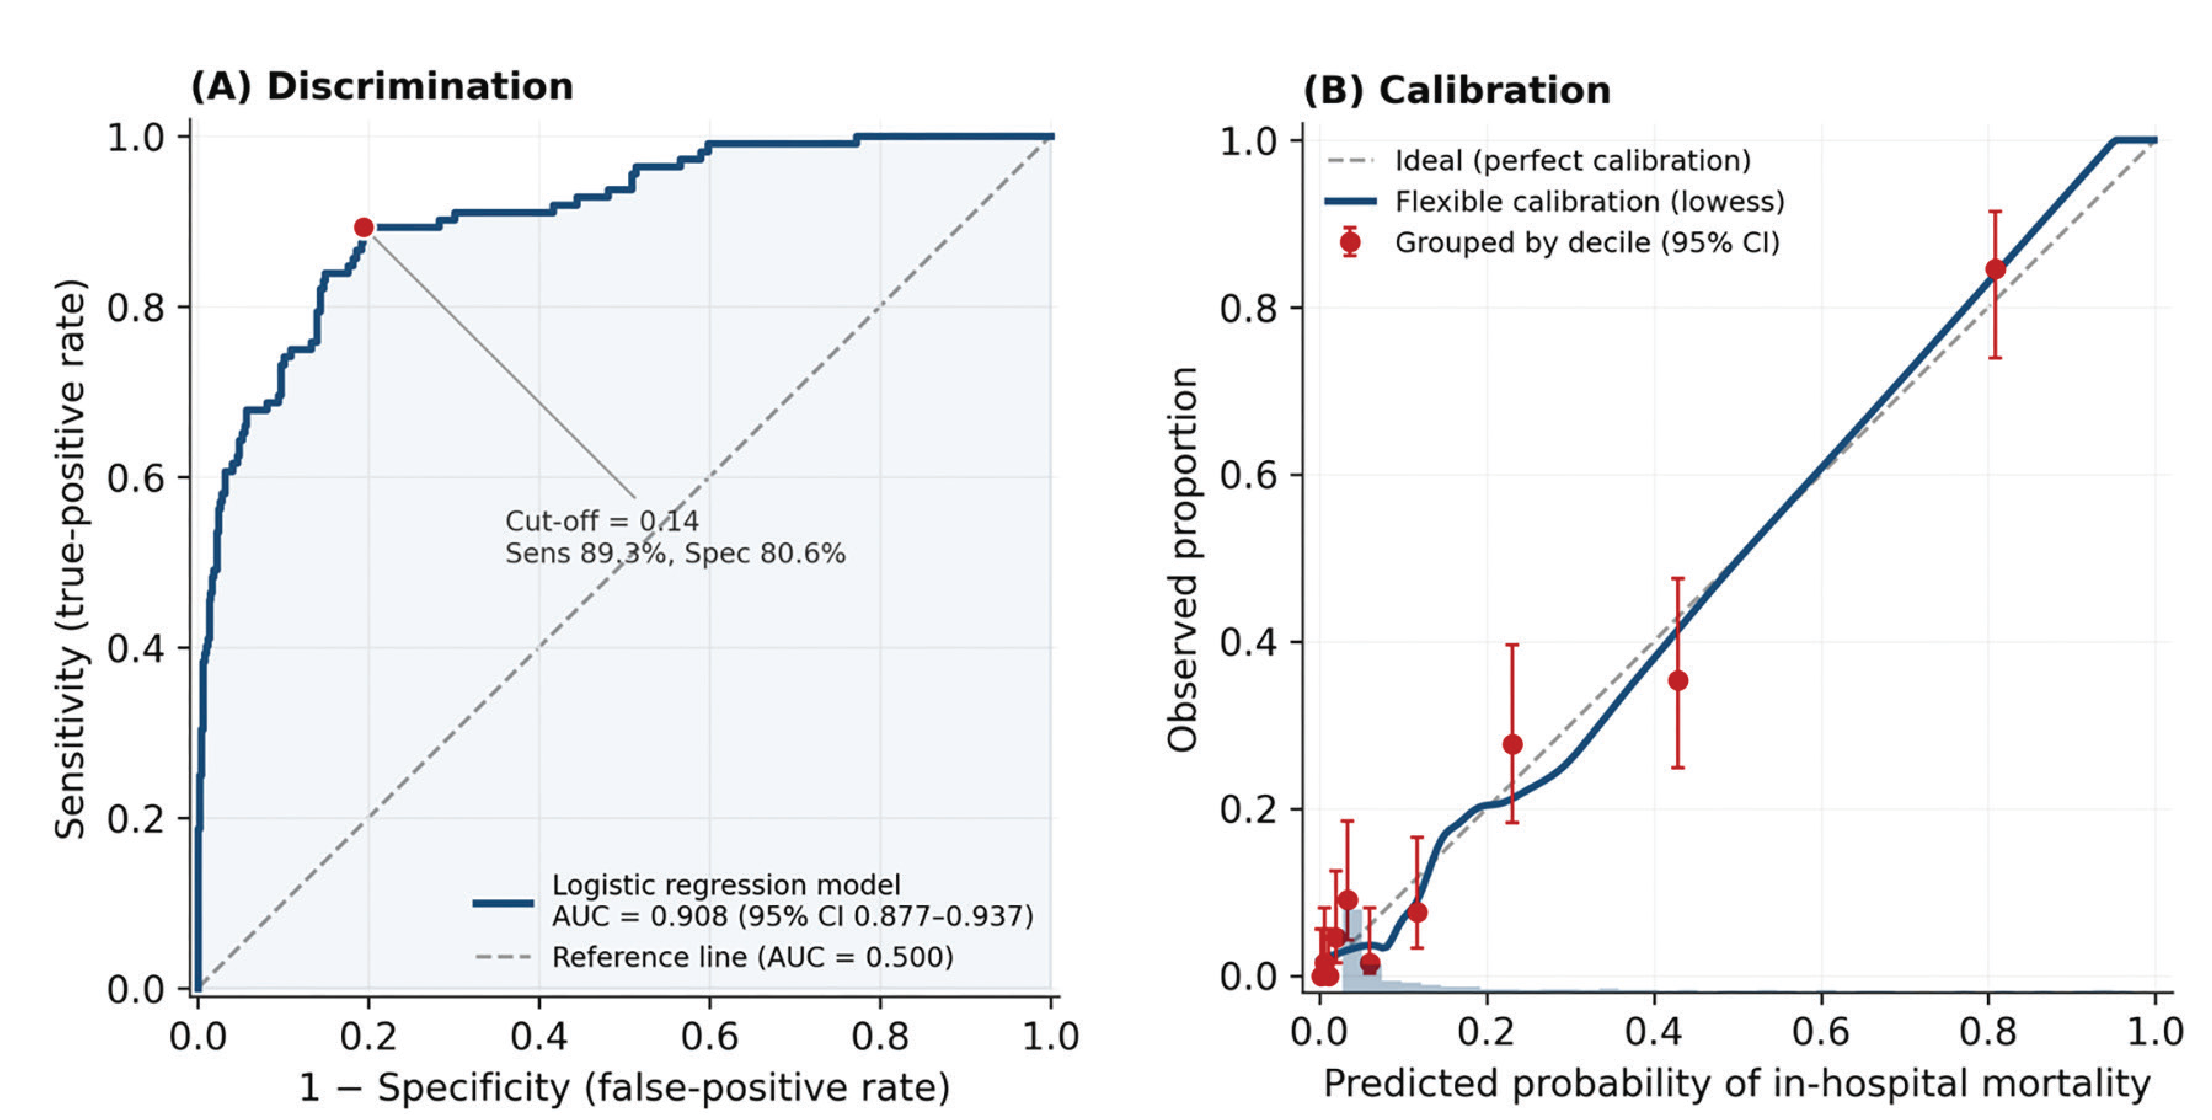
Performance of the multivariable logistic regression model for predicting in-hospital mortality after head trauma (n=657). (A) Receiver-operating-characteristic curve; the area under the curve was 0.91 (95% CI 0.88-0.94). The dashed line is the reference line of no discrimination (AUC=0.500), and the marked point denotes the Youden-optimal threshold (0.14; sensitivity 89.3%, specificity 80.6%). (B) Calibration plot comparing predicted probability with observed proportion of in-hospital mortality. The solid line is the flexible (lowess-smoothed) calibration curve, red points are risk groups by decile of predicted probability (with 95% CIs), and the dashed line represents perfect calibration. The histogram along the horizontal axis shows the distribution of predicted probabilities
AUC: Area under the receiver-operating-characteristic curve, CI: Confidence interval
Discussion
This prospective multicentre study identified four routinely available admission characteristics older age, lower GCS score, higher ISS, and abnormal pupillary reactivity as independent predictors of in-hospital mortality among patients presenting with head trauma. In contrast, intracranial haemorrhage and hypotension did not retain independent associations with mortality after adjustment for the other admission variables. Overall, these findings suggest that early mortality risk after head trauma is shaped by a combination of patient vulnerability, neurological impairment, overall injury burden, and brainstem dysfunction.
In this cohort of 657 patients presenting with head trauma to the ED, in-hospital mortality was 17.0%. When six routinely available admission variables were entered into a single multivariable model, the four independent predictors identified above provided strong prognostic discrimination. The model discriminated between survivors and non-survivors with excellent accuracy (AUC 0.91) and explained a substantial proportion of the variance in outcome (Nagelkerke R2 0.55). These findings indicate that mortality risk after head trauma can be stratified with high accuracy at the very first point of contact, using information a clinician already gathers within minutes of a patient’s arrival.
Our findings are consistent with those of large prognostic studies such as the CRASH and IMPACT models and with brain trauma foundation evidence, which is reassuring: it indicates that established determinants of outcome behave similarly in this previously under-studied population. The contribution of the present study is therefore contextual and practical rather than the introduction of a novel score it demonstrates that a minimal set of admission variables, obtainable at the bedside within minutes and without additional resources, provides accurate mortality discrimination in a resource-limited, multicentre Indonesian emergency setting, thereby extending the external evidence base to a context in which such data have been lacking.
Independent predictors of in-hospital mortality
The value of the model lies less in any single variable than in the fact that its significant predictors describe separate mechanisms of injury and are therefore complementary rather than redundant. Age reflects physiological reserve and the diminished capacity of the older brain to tolerate injury; the GCS reflects global cerebral and functional status; the ISS quantifies the overall anatomical burden of injury across body regions; and pupillary reactivity is a bedside marker of brainstem integrity. That each retained independent significance after mutual adjustment indicates that each contributes prognostic information the others do not, and explains why their combination discriminates so strongly. A patient’s outcome after head trauma is thus governed simultaneously by host vulnerability, the depth of impaired consciousness, the total injury load, and the state of the brainstem and no one of these axes fully substitutes for the others.
Age emerged as an independent predictor of mortality (adjusted OR 1.04 per year), such that each additional decade of life was associated with an approximately 50% increase in the odds of death. This finding aligns closely with established prognostic models of traumatic brain injury, notably the IMPACT and CRASH models, in which age is consistently among the strongest determinants of outcome (,,,,,). The concordance is reassuring, as it suggests that the present cohort behaves in a manner consistent with larger international datasets and that the well-recognised biological vulnerability of older patients reduced cerebral compliance, greater susceptibility to expanding haematomas, and higher burden of comorbidity operates in this setting as elsewhere (,). The independence of age from injury-severity measures also implies that chronological age should be weighted in early risk assessment even when the anatomical and physiological injury appears comparable to that of a younger patient.
Abnormal pupillary reactivity carried the largest independent effect (adjusted OR 3.86), consistent with its role as a clinical signature of raised intracranial pressure and incipient or established transtentorial herniation (). Because pupillary dysfunction typically appears only as rostrocaudal deterioration advances, its strong association with death underscores that an abnormal pupil at admission is an ominous, often late, sign that should trigger immediate action rather than observation (,). The GCS showed a robust inverse relationship with mortality (adjusted OR 0.62 per point), meaning that each single-point fall in the admission score was associated with an almost 40% increase in the odds of death; this dose–response gradient reinforces the prognostic weight of even modest reductions in consciousness and argues against dichotomising the score too coarsely at triage (). The ISS remained independently predictive (adjusted OR 1.08 per point), a reminder that outcome in head trauma is shaped not only by the intracranial injury but by the cumulative physiological insult of concurrent extracranial injuries, which compete for the same resuscitative resources (,,).
Intracranial haemorrhage and hypotension
Radiological intracranial haemorrhage was strongly associated with death in unadjusted analysis (crude OR 2.55) but was markedly attenuated and lost statistical significance after adjustment (adjusted OR 1.35, p=0.294). The most plausible explanation is not that haemorrhage is unimportant, but that much of its lethal effect is expressed through the physiological variables already in the model: a clinically significant bleed manifests as a depressed GCS and, when mass effect develops, as pupillary abnormality. In other words, the imaging finding and the bedside signs are partly different windows onto the same deteriorating process, and once consciousness and pupillary status are accounted for, the incremental information added by the imaging label diminishes. This has a practical corollary physiological assessment at the bedside captures a large share of the prognostic signal even before imaging is available, which is precisely the situation faced in the first minutes of resuscitation and in settings where computed tomography access is delayed.
Hypotension was not independently associated with mortality in this cohort, in apparent contrast to its well-established prognostic importance after head injury (,,). Two factors most likely account for this. First, hypotension was uncommon in the present sample (4.9% of patients), which limited the statistical power to detect an independent effect and yielded a wide, imprecise CI. Second, and more substantively, the lethal impact of systemic hypotension is mediated largely through secondary brain injury, whose downstream consequences deteriorating consciousness and rising injury severity are already captured by the GCS and ISS terms in the model; once these are adjusted for, the residual independent contribution of an admission blood-pressure threshold is diminished. This interpretation is consistent with the view that hypotension is a powerful marker of, and contributor to, secondary insult rather than an independent axis of injury, and it should not be read as evidence that hypotension is clinically unimportant. Aggressive prevention and correction of hypotension remain central to early management (,).
Clinical implications
Taken together, these results have direct operational value for the first phase of care. First, they support the routine, structured, and documented assessment of the GCS and pupillary reactivity at triage, since these two bedside variables carry much of the prognostic weight and any lapse in their recording represents a lost opportunity for early risk stratification. Second, the combined model could be embedded into triage as an admission-based tool to flag high-risk patients before advanced imaging or specialist review; operated at a high-sensitivity threshold, it would act as an early “rule-in for escalation” trigger, prompting expedited neurosurgical consultation, critical-care involvement, and prioritised access to computed tomography and operative resources (,,,). Third, the prominence of pupillary abnormality both highly predictive and time-sensitive argues for staff training and serial reassessment of pupillary responses. Fourth, the independent contribution of age warrants heightened vigilance and a lower escalation threshold in older patients, even when the initial injury appears moderate. Finally, because bedside physiology captures much of the signal otherwise attributed to imaging, aggressive protocolised early management—airway protection, prevention of secondary hypoxic and hypotensive insults, and rapid escalation—is justified in patients with a low GCS and abnormal pupils without awaiting radiological confirmation (,). In resource-limited emergency settings in particular, a model requiring only clinical and basic imaging information offers a pragmatic route to earlier, better-targeted intervention.
Study Limitations
Several limitations should be considered when interpreting these findings. First, although the model demonstrated strong discrimination, calibration was borderline on the Hosmer-Lemeshow test. This finding suggests that the estimated probabilities of mortality may not be sufficiently accurate for individual-level clinical decision-making without further assessment and, if necessary, recalibration. The Hosmer-Lemeshow test is also sensitive to sample size; therefore, this result should be interpreted alongside the graphical calibration assessment rather than in isolation.
Second, the model was developed and evaluated using the same dataset and was not externally validated. Its apparent predictive performance may therefore be optimistic, and equivalent discrimination and calibration cannot be assumed in populations with different patient characteristics, referral pathways, pre-hospital systems, or hospital resources. Consequently, the present findings support prognostic associations within this cohort but should not yet be interpreted as establishing a prediction model ready for routine application in other settings.
Third, the observational design precludes causal inference. Although the multivariable analysis adjusted for the six prespecified admission characteristics, residual confounding from variables not measured in this study, including pre-hospital management, time from injury to definitive care, comorbidity, oxygenation status, medication use, and subsequent treatment, cannot be excluded. The observed associations should therefore be interpreted as prognostic rather than causal.
Fourth, the study population comprised patients who survived to formal assessment. Patients who were dead on arrival and those transferred before an in-hospital outcome could be ascertained were excluded. Accordingly, the findings may not be generalisable to patients with the most immediately fatal injuries or to individuals whose outcomes are determined after transfer to another institution. The absence of a time-based inclusion cut-off allowed the cohort to reflect the range of presentation intervals encountered in routine emergency practice, but differences in pre-hospital delay may nevertheless have influenced the observed clinical condition at admission.
Fifth, the model was intentionally restricted to six admission variables to preserve its potential practicality in resource-limited emergency settings. This approach may, however, have omitted additional prognostic information. Intracranial haemorrhage was analysed as a binary variable without accounting for haemorrhage subtype, volume, anatomical location, or mass effect, and potentially relevant variables such as peripheral oxygen saturation, comorbidities, anticoagulant or antiplatelet use, mechanical ventilation, and definitive surgical interventions were not included. These limitations may partly explain why some established prognostic factors did not retain independent associations in the adjusted model and may limit the completeness of individual risk estimation.
Despite these limitations, the study has several strengths. Its prospective, multicentre design and consecutive recruitment across one tertiary referral hospital and three secondary district hospitals provided a clinically heterogeneous cohort representing routine emergency care across different levels of service. Data were collected prospectively using a standardised case-report form, and key clinical variables were assessed using common definitions across participating centres. Inter-rater reliability was evaluated for GCS score, pupillary status, and intracranial haemorrhage, with substantial to almost perfect agreement, supporting the consistency of measurement across raters. In addition, the achieved sample included a sufficient number of mortality events relative to the number of candidate predictors, reducing the risk of severe model overfitting. Finally, the study focused on variables available at the time of ED admission and evaluated both discrimination and calibration, increasing the clinical relevance of the findings for early risk assessment while providing a transparent basis for future external validation.
Conclusion
Among patients with head trauma presenting to the ED, in-hospital mortality could be predicted with high accuracy from a few variables available at admission. In a multivariable model, older age, a lower GCS score, a higher ISS, and abnormal pupillary reactivity were each independently associated with death and together showed excellent discrimination (AUC 0.91). These bedside predictors, assessable within minutes of arrival, support the routine documentation of consciousness level and pupillary status at triage and could help identify high-risk patients early particularly older patients for expedited escalation of care. Given its borderline calibration and lack of external validation, however, the model should be regarded as hypothesis-generating, requiring external validation and recalibration before routine clinical use.
Ethics
Ethics Committee Approval: This study was approved by the Health Research Ethics Committee of Universitas Muhammadiyah Gombong (protocol number 11125000015; reference number 063.6/II.3.AU/F/KEPK/VI/2025), issued on 1 June 2025 and valid until 2 June 2026. The study was conducted in accordance with the principles of the Declaration of Helsinki and the 2016 CIOMS International Ethical Guidelines.
Informed Consent: Written informed consent was obtained from all participants or their legally authorised representatives prior to enrolment.
Footnotes
Acknowledgements
The authors would like to thank the staff of the emergency departments of participating hospitals for their assistance during data collection, and all patients who participated in this study.
During the preparation of this work, the authors used an artificial-intelligence-based writing-assistance tool for language correction only. No AI tool was used for study design, data collection, data analysis, interpretation of results, or the generation of scientific content. After using this tool, the authors reviewed and edited the manuscript as needed and take full responsibility for the content of the published article.
Authorship Contributions
Concept: P.A.W.S., F.K., Design: P.A.W.S., A.K., F.K., Data Collection or Processing: P.A.W.S., A.W., A.K., S.P., I.W., W.A., I.Y.S., Analysis or Interpretation: P.A.W.S., F.K., Literature Search: P.A.W.S., A.W., A.K., F.K., Writing: P.A.W.S.
Conflict of Interest
No conflict of interest was declared by the authors.
Financial Disclosure
This research received no specific grant from any funding agency in the public, commercial, or not-for-profit sectors.
References
Wang Y. Global, regional, and national burdens of traumatic brain injury, spinal cord injury, and skull fracture and their attributable risk factors from 1990 to 2021: a systematic analysis of the global burden of disease study 2021. Front Public Health. 2025;13:1622693.
Rahman FNN, Das S, Kader M, Mashreky SR. Epidemiology, outcomes, and risk factors of traumatic brain injury in Bangladesh: a prospective cohort study with a focus on road traffic injury-related vulnerability. Front Public Health. 2025;13:1514011.
Laccarino C, Gerosa A, Viaroli E. Epidemiology of traumatic brain injury. In: Honeybul S, Kolias AG, editors. Traumatic brain injury: science, practice, evidence and ethics [Internet]. Cham: Springer International Publishing; 2021 [cited 2026 Jul 5]. p. 3-11. Available from: https://doi.org/10.1007/978-3-030-78075-3_1
Zhang Q, Tang D, Chen T, Ai Y, Chen Z, Liu G, et al. Global, regional, and national burden of transport-related moderate/severe traumatic brain injury, 1992–2021: a cross-sectional time-trend analysis of GBD 2021. Int J Surg. 2026;112(2):2360.
Korley FK, Kelen GD, Jones CM, Diaz-Arrastia R. Emergency department evaluation of traumatic brain injury in the United States, 2009-2010. J Head Trauma Rehabil. 2016;31(6):379-387.
Pélieu I, Kull C, Walder B. Prehospital and emergency care in adult patients with acute traumatic brain injury. Med Sci (Basel). 2019;7(1):12.
Zogg CK, Haring RS, Xu L, Canner JK, Ottesen TD, Salim A, et al. Patient presentations in outpatient settings: epidemiology of adult head trauma treated outside of hospital emergency departments. Epidemiology. 2018;29(6):885.
Bodien YG, Barra A, Temkin NR, Barber J, Foreman B, Vassar M, et al.; TRACK-TBI Investigators. Diagnosing level of consciousness: the limits of the Glasgow Coma Scale total score. J Neurotrauma. 2021;38(23):3295-3305.
Senapathi TGA, Wiryana M, Aribawa IGNM, Ryalino C. Bispectral index value correlates with Glasgow Coma Scale in traumatic brain injury patients. Open Access Emerg Med. 2017;9:43-46.
Van Deynse H, Cools W, Depreitere B, Hubloue I, Kazadi CI, Kimpe E, et al. Quantifying injury severity for traumatic brain injury with routinely collected health data. Injury. 2022;53(1):11-20.
Kazemi F, Liu J, Nasr IW, Robinson S, Cohen AR. A comparative analysis of the trauma and injury severity score and the injury severity score in predicting high-value care outcomes in children with traumatic brain injury. J Neurosurg Pediatr. 2024;34(6):557-565.
Khokhar AM, Gull Z, Ali R. Head injury and intracranial hemorrhages: a CT imaging study of trauma patients. Medical Science and Discovery. 2023;10(3):168-171.
Hillal A, Ullberg T, Ramgren B, Wassélius J. Computed tomography in acute intracerebral hemorrhage: neuroimaging predictors of hematoma expansion and outcome. Insights Imaging. 2022;13(1):180.
Lee JW, Wang W, Rezk A, Mohammed A, Macabudbud K, Englesakis M, et al. Hypotension and adverse outcomes in moderate to severe traumatic brain injury: a systematic review and meta-analysis. JAMA Netw Open. 2024;7(11):e2444465.
Price J, Lachowycz K, Major R, McLachlan S, Keeliher C, Finbow B, et al. Prehospital postintubation hypotension and survival in severe traumatic brain injury. JAMA Netw Open. 2025;8(11):e2544057.
Saengrung S, Kaewborisutsakul A, Tunthanathip T, Phuenpathom N, Taweesomboonyat C. Risk factors for intraoperative hypotension during decompressive craniectomy in traumatic brain injury patients. World Neurosurg. 2022;162:e652-e658.
Dutta P, Atiya A, Vittal S, Ambika S, Hussaindeen JR. Pupillary dynamics and accommodative response in mild traumatic brain injury. Taiwan J Ophthalmol. 2023;14(2):248-255.
Trent T, Vashisht A, Novakovic S, Kanter G, Nairon E, Lark A, et al. Pupillary light reflex measured with quantitative pupillometry has low sensitivity and high specificity for predicting neuroworsening after traumatic brain injury. J Am Assoc Nurse Pract. 2023;35(2):130-134.
Yue JK, Lee YM, Sun X, van Essen TA, Elguindy MM, Belton PJ, et al.; The TRACK-TBI Investigators. Performance of the IMPACT and CRASH prognostic models for traumatic brain injury in a contemporary multicenter cohort: a TRACK-TBI study. J Neurosurg. 2024;141(2):417-429.
Zarei H, Vazirizadeh-Mahabadi M, Adel Ramawad H, Sarveazad A, Yousefifard M. Prognostic value of CRASH and IMPACT models for predicting mortality and unfavorable outcome in traumatic brain injury; a systematic review and meta-analysis. Arch Acad Emerg Med. 2023;11(1):e27.
de Cássia Almeida Vieira R, Silveira JCP, Paiva WS, de Oliveira DV, de Souza CPE, Santana-Santos E, et al. Prognostic models in severe traumatic brain injury: a systematic review and meta-analysis. Neurocrit Care. 2022;37(3):790-805.
Martin GP, Riley RD, Ensor J, Grant SW. Statistical primer: sample size considerations for developing and validating clinical prediction models. Eur J Cardiothorac Surg. 2025;67(5):ezaf142.
Eagle SR, Nwachuku E, Elmer J, Deng H, Okonkwo DO, Pease M. Performance of CRASH and IMPACT prognostic models for traumatic brain injury at 12 and 24 months post-injury. Neurotrauma Rep. 2023;4(1):118-123.
Dams-O’Connor K, Juengst SB, Bogner J, Chiaravalloti ND, Corrigan JD, Giacino JT, et al. Traumatic brain injury as a chronic disease: insights from the United States traumatic brain injury model systems research program. Lancet Neurol. 2023;22(6):517-528.
Yang B, Sun X, Shi Q, Dan W, Zhan Y, Zheng D, et al. Prediction of early prognosis after traumatic brain injury by multifactor model. CNS Neurosci Ther. 2022;28(12):2044-2052.
Chieregato A, Querci L. Integration of brain oxygen measurement and cerebral metabolism: brain tissue oxygenation, jugular bulb oximetry, intracerebral microdialysis and brain neuromarkers. In: Brogi E, Coccolini F, Ley EJ, Valadka A, editors. Traumatic brain injury [Internet]. Cham: Springer International Publishing; 2024 [cited 2026 Jul 5]. p. 165-209. Available from: https://doi.org/10.1007/978-3-031-50117-3_11
Gupta A, Bansal R, Sharma A, Kapil A. Pupillary signs. In: Gupta A, Bansal R, Sharma A, Kapil A, editors. Ophthalmic signs in practice of medicine [Internet]. Singapore: Springer Nature; 2023 [cited 2026 Jul 5]. p. 475-492. Available from: https://doi.org/10.1007/978-981-99-7923-3_16
Alison L, Shortland N, Herrod-Taylor C, Stevens C, Christiansen P. Medical maximization: the effect of personality on triage decision-making. Soc Sci Med. 2024;352:117006.
Bick H, Wasfie T, Labond V, Hella JR, Pearson E, Barber KR. Traumatic brain injury in the elderly with high Glasgow Coma Scale and low injury severity scores: factors influencing outcomes. Am J Emerg Med. 2022;51:354-357.
Kennedy L, Nuno M, Gurkoff GG, Nosova K, Zwienenberg M. Moderate and severe TBI in children and adolescents: the effects of age, sex, and injury severity on patient outcome 6 months after injury. Front Neurol. 2022;13:741717.
Lin PC, Liu CY, Tzeng IS, Hsieh TH, Chang CY, Hou YT, et al. Shock index, modified shock index, age shock index score, and reverse shock index multiplied by Glasgow Coma Scale predicting clinical outcomes in traumatic brain injury: evidence from a 10-year analysis in a single center. Front Med (Lausanne). 2022;9:999481.
Robba C, McCredie V, Chesnut RM, Citerio G, Gauss T, Hawryluk GWJ, et al. Traumatic brain injury management in the intensive care unit: standard of care and knowledge gaps. Intensive Care Med. 2025;51(6):1112-1127.
Rice AD, Hu C, Spaite DW, Barnhart BJ, Chikani V, Gaither JB, et al. Correlation between prehospital and in-hospital hypotension and outcomes after traumatic brain injury. Am J Emerg Med. 2023;65:95-103.
Eichinger M, Schreiber MA, Cole E, Aylwin C. Injuries associated with hypotension after trauma: is it always haemorrhage? Trauma. 2023;25(4):316-323.
Fort AC, Cordoba Torres I, Parker R. Hypotension and shock. In: Mahanna Gabrielli E, O’Phelan KH, Kumar MA, Levine J, Le Roux P, Gabrielli A, et al., editors. Textbook of neurointensive care: Volume 1: Neuroanatomy, diagnostic assessment, disease management [Internet]. Cham: Springer International Publishing; 2024 [cited 2026 Jul 5]. p. 159-171. Available from: https://doi.org/10.1007/978-3-031-62220-5_10
Wiles MD, Braganza M, Edwards H, Krause E, Jackson J, Tait F. Management of traumatic brain injury in the non-neurosurgical intensive care unit: a narrative review of current evidence. Anaesthesia. 2023;78(4):510-520.
Picetti E, Catena F, Abu-Zidan F, Ansaloni L, Armonda RA, Bala M, et al. Early management of isolated severe traumatic brain injury patients in a hospital without neurosurgical capabilities: a consensus and clinical recommendations of the World Society of Emergency Surgery (WSES). World J Emerg Surg. 2023;18(1):5. Erratum in: World J Emerg Surg. 2023;18(1):29.
Buccilli B, Alan A, Aljeradat BG, Shahzad A, Almealawy YF, Chisvo NS, et al. Neuroprotection: surgical approaches in traumatic brain injury. Surg Neurol Int. 2024;15:23.
Bajjah MAA, Hadi AMA, Abuhashim HAY, Shabaani AYI, Alghamdi HAH, Alfaheed SR, et al. Multidisciplinary management of traumatic brain injury: emergency care, early physical therapy, laboratory monitoring, and radiologic evaluation. Saudi J Med Public Health. 2025;2(2):3425-3437.
Bradford JM, Trust MD, Kempema J, Brown CVR. Out-of-hospital management of traumatic brain injury. In: Brogi E, Coccolini F, Ley EJ, Valadka A, editors. Traumatic brain injury [Internet]. Cham: Springer International Publishing; 2024 [cited 2026 Jul 5]. p. 227-241. Available from: https://doi.org/10.1007/978-3-031-50117-3_13
Mahajan C, Sengupta D, Kapoor I, Prabhakar H, Kumar V, Purohit S, et al. Evaluation of the GCS-pupils score for PrOgnosis in trauMatic brAin injury- the COMA study. Brain Inj. 2023;37(9):1041-1047.